Climate Impacts in Tanzania

Illustrates climate change in two sectors in a tropical climate.
Select a sector and explore.
- Climate (7) chevron_right
- Agriculture (1) chevron_right
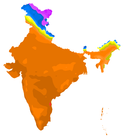
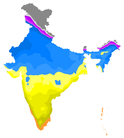
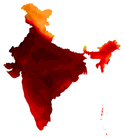
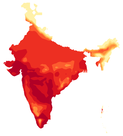
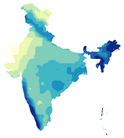
Climate Impacts in India

Illustrates climate change in two sectors over multiple climate zones.
Select a sector and explore.
- Climate (9) chevron_right
- Agriculture (7) chevron_right
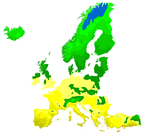
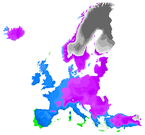
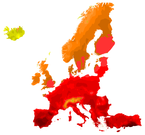
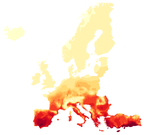
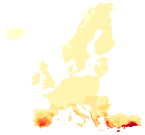
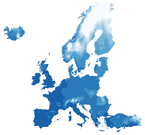
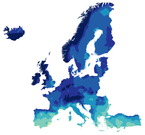
Climate Impacts in Europe

Illustrates climate change in one sector over multiple climate zones.
Select a sector and explore.
- Climate (20) chevron_right
- Agriculture (8) chevron_right
- Water (10) chevron_right
- Health (9) chevron_right
- Socioeconomics (4) chevron_right
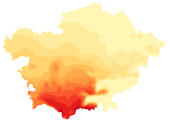
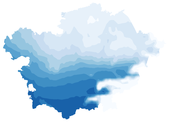
Climate Impacts in Germany

Illustrates climate change in multiple sectors in a temperate climate.
Select a sector and explore.
- Climate (26) chevron_right
- Agriculture (7) chevron_right
- Forest & biodiversity (3) chevron_right
- Water (12) chevron_right
- Health (3) chevron_right
- Tourism (3) chevron_right
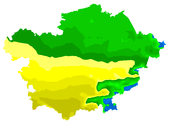
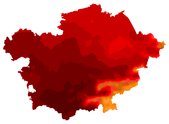
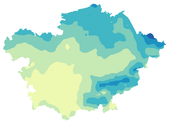
Climate Impacts in Central Asia

Illustrates climate change in two sectors over multiple climate zones.
Select a sector and explore.
- Climate (17) chevron_right
- Agriculture (14) chevron_right
- Water (4) chevron_right
- Energy (1) chevron_right
- Health (9) chevron_right
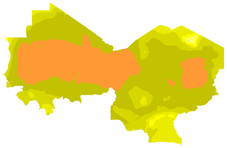
Climate Impacts in the Sahel Region

Illustrates climate change in two sectors in a tropical and desert zone.
Select a sector and explore.
- Climate (7) chevron_right
- Agriculture (56) chevron_right
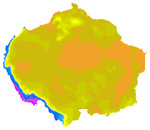
Climate Impacts in the Amazon

Illustrates climate change in three sectors in a humid tropical climate.
Select a sector and explore.
- Climate (8) chevron_right
- Forest & Biodiversity (8) chevron_right
- Water (2) chevron_right
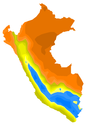
Climate Impacts in Peru

Illustrates climate change in two sectors over multiple climate zones.
Select a sector and explore.
- Climate (16) chevron_right
- Agriculture (1) chevron_right
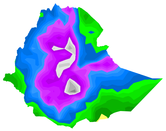
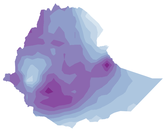
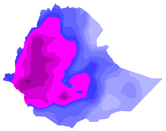
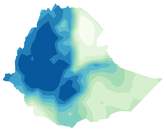
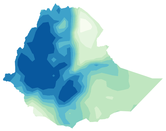
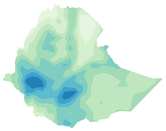
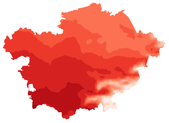
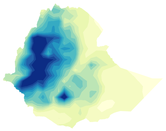
Climate Impacts in Ethiopia

Illustrates climate change in four sectors in a humid tropical climate.
Select a sector and explore.
- Climate (9) chevron_right
- Agriculture (19) chevron_right
- Forest & Biodiversity (7) chevron_right
- Water (2) chevron_right
Climate Impacts in Jordan

Illustrates climate change in one sector in a mediterranean climate.
Select a sector and explore.
- Climate (19) chevron_right
Climate Impacts in the Congo River Basin

Illustrates climate change in one sector in a humid tropical climate.
Select a sector and explore.
- Climate (11) chevron_right
- Water (8) chevron_right
Climate Impacts in Bavaria

Illustrates climate change in a federal state of Germany.
Select a sector and explore.
- Climate (27) chevron_right
The sector Climate depicts the climatic changes, the other sectors illustrate possible impacts induced by the changing climate. For an overview of the available variables, please select the desired sector and explore the variable previews in their respective countries / regions:
| Tanzania | India | Europe | Germany | Central Asia | Sahel region | Amazon | Peru | Ethiopia | Jordan | Congo river basin | Bavaria | |
|---|---|---|---|---|---|---|---|---|---|---|---|---|
| Temperature | ||||||||||||
| Mean air temperature Mean Near-Surface Air Temperature |

|
|
|

|
|
|
|
|

|

|

|

|
| Minimum air temperature Total Minimum Air Temperature in year/season |

|
|
|

|
|
|
|
|
|

|

|

|
| Maximum air temperature Total Maximum Air Temperature in year/season |

|
|
|

|
|
|
|
|
|

|

|

|
| Air temperature range Maximum Daily Near-Surface Air Temperature Range |

|
|
|

|
|

|

|
|
|

|

|

|
| Hot days Number of hot days |

|
|
|

|
|
|
|
|
|

|

|

|
| Frost days Number of frost days |

|
|

|
|

|

|
||||||
| Ice days Number of ice days |

|
|

|
|

|
|||||||
| Summer days Number of summer days (>=25°C) |

|

|

|

|
||||||||
| Very hot days Number of very hot days (>=35°C) |

|

|

|

|

|

|
||||||
| Tropical nights Number of tropical nights (>=20°C) |

|

|

|

|

|
|||||||
| Continuous hot days Maximum continuous hot days |
|

|
|

|

|

|
||||||
| Continuous frost days Maximum continuous frost days |
|

|
|

|

|
|||||||
| Continuous ice days Maximum continuous ice days |
|

|
|

|
||||||||
| Precipitation | ||||||||||||
| Precipitation Precipitation |

|
|
|

|
|
|
|
|
|

|

|

|
| Wet days Number of wet days |

|
|
|

|
|
|

|
|

|

|

|
|
| Strong precipition days Number of strong precipition days |

|

|

|

|
||||||||
| Wettest day Wettest day of year / season |

|

|

|

|

|

|

|
|||||
| Continuous dry days Maximum continuous dry days |

|

|

|
|||||||||
| Dry days Number of dry days (<= 1mm) |

|

|

|

|
||||||||
| Snow depth Average snow depth |

|

|
||||||||||
| 10cm snow days Days with at least 10cm snow depth |

|

|
||||||||||
| 30cm snow days Days with at least 30cm snow depth |

|

|
||||||||||
| Maximum Precipitation Maximum Precipitation |

|
|||||||||||
| Consecutive dry days index Yearly consecutive dry days |

|
|||||||||||
| Further | ||||||||||||
| Relative humidity Near-Surface Humidity |
|

|
|
|
|

|

|

|
||||
| Global radiation Global Radiation Energy |
|
|

|

|

|

|

|
|||||
| Wind | ||||||||||||
| Mean wind speed Mean wind speed per year / season |

|

|
||||||||||
| Windy days Windy days (mean wind >= 25 km/h) |

|

|
||||||||||
| Maximum wind speed Maximum daily mean wind speed in a year / season |

|

|
||||||||||
| Precipitation Cordex | ||||||||||||
| Precipitation 03-hr Max. 3 hourly precipitation |

|
|||||||||||
| Precipitation 06-hr Max. 6 hourly precipitation |

|
|||||||||||
| Precipitation 09-hr Max. 9 hourly precipitation |

|
|||||||||||
| Precipitation 12-hr Max. 12 hourly precipitation |

|
|||||||||||
| Precipitation 24-hr Precipitation 24 hourly |

|
| Tanzania | India | Europe | Germany | Central Asia | Sahel region | Peru | Ethiopia | ||||
|---|---|---|---|---|---|---|---|---|---|---|---|
| Precipitation | |||||||||||
| Consecutive dry days index Consecutive dry days index per year |

|
|

|
|
|
|
|
||||
| Growing Degree Days for | |||||||||||
| Kharif rice GDD: Kharif rice |
|
||||||||||
| Rabi wheat GDD: Rabi wheat |
|
||||||||||
| Wine (Huglin index) Huglin index for wine groth |

|
||||||||||
| Summer Wheat GDD: Summer Wheat |

|
||||||||||
| Winter Wheat GDD: Winter Wheat |

|
||||||||||
| Maize GDD: Maize |

|
||||||||||
| Canola GDD: Canola |

|
||||||||||
| Teff GDD: Teff |
|
||||||||||
| Maize GDD: Maize |
|
||||||||||
| Wheat GDD: Wheat |
|
||||||||||
| Sorghum GDD: Sorghum |
|
||||||||||
| Millet GDD: Millet |
|
||||||||||
| Coffea Arabica GDD: Coffea Arabica |
|
||||||||||
| Global Radiation for | |||||||||||
| Kharif rice Radiation: Kharif rice |
|
||||||||||
| Rabi wheat Radiation: Rabi wheat |
|
||||||||||
| Teff Radiation: Teff |
|
||||||||||
| Maize Radiation: Maize |

|
||||||||||
| Wheat Radiation: Wheat |

|
||||||||||
| Sorghum Radiation: Sorghum |
|
||||||||||
| Millet Radiation: Millet |

|
||||||||||
| Coffea Arabica Radiation: Coffea Arabica |
|
||||||||||
| Relative Humidity for | |||||||||||
| Kharif rice Humidity: Kharif rice |
|
||||||||||
| Rabi wheat Humidity: Rabi wheat |
|
||||||||||
| Teff Humidity: Teff |

|
||||||||||
| Maize Humidity: Maize |
|
||||||||||
| Wheat Humidity: Wheat |

|
||||||||||
| Sorghum Humidity: Sorghum |

|
||||||||||
| Millet Humidity: Millet |
|
||||||||||
| Coffea Arabica Humidity: Coffea Arabica |
|
||||||||||
| Summer wheat | |||||||||||
| Yield (Irrigated) Crop Yield (Irr): Summer Wheat |

|

|
|||||||||
| Yield (Non-irrigated) Crop Yield (Noirr): Summer Wheat |

|

|
|||||||||
| Growing degree days GDD: Summer Wheat |
|
||||||||||
| Global radiation Radiation: Summer Wheat |
|
||||||||||
| Humidity Humidity: Summer Wheat |
|
||||||||||
| Winter wheat | |||||||||||
| Yield (Irrigated) Crop Yield (Irr): Winter Wheat |

|

|
|||||||||
| Yield (Non-irrigated) Crop Yield (Noirr): Winter Wheat |

|

|
|||||||||
| Growing degree days GDD: Winter Wheat |
|
||||||||||
| Global radiation Radiation: Winter Wheat |
|
||||||||||
| Humidity Humidity: Winter Wheat |
|
||||||||||
| Maize | |||||||||||
| Yield (Irrigated) Crop Yield (Irr): Maize |

|
||||||||||
| Yield (Non-irrigated) Crop Yield (Noirr): Maize |

|
||||||||||
| Soy | |||||||||||
| Yield (Irrigated) Crop Yield (Irr): Soy |

|
||||||||||
| Yield (Non-irrigated) Crop Yield (Noirr): Soy |

|
||||||||||
| Precipitation for | |||||||||||
| Canola Precipitation: Canola |

|
||||||||||
| Cotton | |||||||||||
| Growing degree days GDD: Cotton |
|
||||||||||
| Global radiation Radiation: Cotton |
|
||||||||||
| Humidity Humidity: Cotton |
|
| Germany | Amazon | Ethiopia | |||||||||
|---|---|---|---|---|---|---|---|---|---|---|---|
| Fire danger | |||||||||||
| Forest fire risk index Annual mean M68 forest fire danger index |

|
||||||||||
| High fire danger days Days with high fire danger (M68 level 4-5) |

|
||||||||||
| Very high fire danger days Days with very high fire danger (M68 level 5) |

|
||||||||||
| No CO₂ fertilization | |||||||||||
| Aboveground biomass Aboveground biomass |
|

|
|||||||||
| Evapotranspiration Evapotranspiration |
|

|
|||||||||
| Net primary production Net primary production |
|
|
|||||||||
| With CO₂ fertilization | |||||||||||
| Aboveground biomass Aboveground biomass |
|
|
|||||||||
| Evapotranspiration Evapotranspiration |
|
|
|||||||||
| Net primary production net primary production |
|
|
|||||||||
| Climatic drivers | |||||||||||
| Potential evapotranspiration Potential evapotranspiration |
|

|
|||||||||
| Dry season length Dry season length (precipitation < 100 mm) |

|
| Europe | Germany | Central Asia | Amazon | Ethiopia | Congo river basin | ||||||
|---|---|---|---|---|---|---|---|---|---|---|---|
| Atmospheric and Climatic | |||||||||||
| Precipitation Yearly Precipitation |

|

|

|
||||||||
| Actual evapotranspiration Actual evapotranspiration |

|

|

|
||||||||
| Potential evapotranspiration Potential evapotranspiration |

|

|

|
||||||||
| Climatic water balance Climatic water balance |

|

|
|||||||||
| Water yield Yearly water yield |

|

|
|||||||||
| Soil and Groundwater | |||||||||||
| Groundwater recharge Yearly Groundwater recharge |

|

|
|||||||||
| Subsurface runoff Yearly water subsurface runoff |

|

|
|||||||||
| River Basins | |||||||||||
| Surface runoff Yearly water surface runoff |

|

|
|||||||||
| Maximum discharge Maximum water discharge |

|

|
|||||||||
| Minimum discharge Minimum water discharge |

|

|
|||||||||
| Average water baseflow Average water baseflow |

|

|
|||||||||
| Groundwater recharge Yearly Groundwater recharge |

|
||||||||||
| Subsurface runoff Yearly water subsurface runoff |

|
||||||||||
| Surface runoff Yearly water surface runoff |

|
||||||||||
| Water yield Yearly water yield |

|
||||||||||
| Mean discharge Mean water discharge |

|
||||||||||
| Potential evapotranspiration Potential evapotranspiration |
|
|
|
||||||||
| Total evapotranspiration Total evapotranspiration |

|
||||||||||
| Total runoff Total water runoff |
|
|
|
||||||||
| Snow water equivalent Snow water equivalent |
|
| Germany | Central Asia | ||||||||||
|---|---|---|---|---|---|---|---|---|---|---|---|
| Photovoltaics potential Photovoltaics potential |
|
| Europe | Germany | Central Asia | |||||||||
|---|---|---|---|---|---|---|---|---|---|---|---|
| Heat stress overview | |||||||||||
| Mean wet-bulb temperature Yearly Mean of Wet-bulb Globe Temperature |

|

|
|||||||||
| Maximum wet-bulb temperature Yearly Maximum Value of Wet-bulb Globe Temperature |

|

|
|||||||||
| Minimum wet-bulb temperature Yearly Minimum value of Wet-bulb Globe Temperature |

|

|
|||||||||
| Heat stress during hottest hours | |||||||||||
| Days with strong heat risk Days with strong heat risk (WBGT daily maximum above 29 °C) |

|

|
|||||||||
| Days with extreme heat risk Days with extreme heat risk (WBGT daily maximum above 31 °C) |

|

|
|||||||||
| Days with live threathening heat Days with live threathening heat (WBGT daily maximum above 33 °C) |

|
||||||||||
| Days with live threathening heat Days with live threathening heat (WBGT daily maximum above 35 °C) |

|
||||||||||
| Whole day heat stress | |||||||||||
| Days with strong heat risk Days with strong heat risk (WBGT daily mean above 29 °C) |

|

|
|||||||||
| Days with extreme heat risk Days with extreme heat risk (WBGT daily mean above 31 °C) |

|

|
|||||||||
| Days with extreme heat risk Days with extreme heat risk (WBGT daily mean above 33 °C) |

|
||||||||||
| Days with live threathening heat Days with live threathening heat (WBGT daily mean above 35 °C) |

|
||||||||||
| Day heat risks | |||||||||||
| Hot days Number of hot days (>=30°C) |

|
||||||||||
| Very hot days Number of very hot days (>=30°C) |

|
||||||||||
| Night heat risks | |||||||||||
| Tropical nights Number of tropical nights (>=20°C) |

|
| Germany | |||||||||||
|---|---|---|---|---|---|---|---|---|---|---|---|
| Summer tourism | |||||||||||
| Summer days Number of summer days (>=25°C) |

|
||||||||||
| Winter tourism | |||||||||||
| Snow depth Average snow depth |

|
||||||||||
| 10cm snow days Days with at least 10cm snow depth |

|
| Europe | |||||||||||
|---|---|---|---|---|---|---|---|---|---|---|---|
| Labor Productivity | |||||||||||
| Light intensity work productivity Daily Mean Labor Productivity |

|
||||||||||
| Medium intensity work productivity Daily Mean Labor Productivity |

|
||||||||||
| High intensity work productivity Daily Mean Labor Productivity |

|
||||||||||
| Very high intensity work productivity Daily Mean Labor Productivity |

|
Welcome to ClimateImpactsOnline data visualization portal, which offers maps, diagrams and tabular data supplemented by additional information texts and data download functionality. The portal is available in the languages of the displayed regions. The visualized data includes historical simulations, observations and future scenarios for three emission pathways (SSP 1.26, SSP 3.70 and SSP 5.85). For more information on how to use the portal, please see the Settings and Diagrams tabs.
Within a country page, use the top menu to select a climate sector and a variable. Choose a climate scenario from the scenario bar: historical observations, or future projections under different emission pathways (SSP 1.26, SSP 3.70 and SSP 5.85). The time period slider adjusts the displayed decade. Switch between the map view and the diagram view using the navigation buttons. The map rendering can be toggled between colour-fill and contour-line display.
The diagram view shows how the selected climate variable changes over time. Line charts display historical observations alongside future projections for all available scenarios. The central line represents the median across the model ensemble; shaded bands show the spread between the 10th and 90th percentiles. Hover over the chart to read exact values. Use the download button to export the chart as an image or the underlying data as a CSV file.